Graphical Datasheets
Code, final versions, and information on the SparkFun Graphical Datasheets.
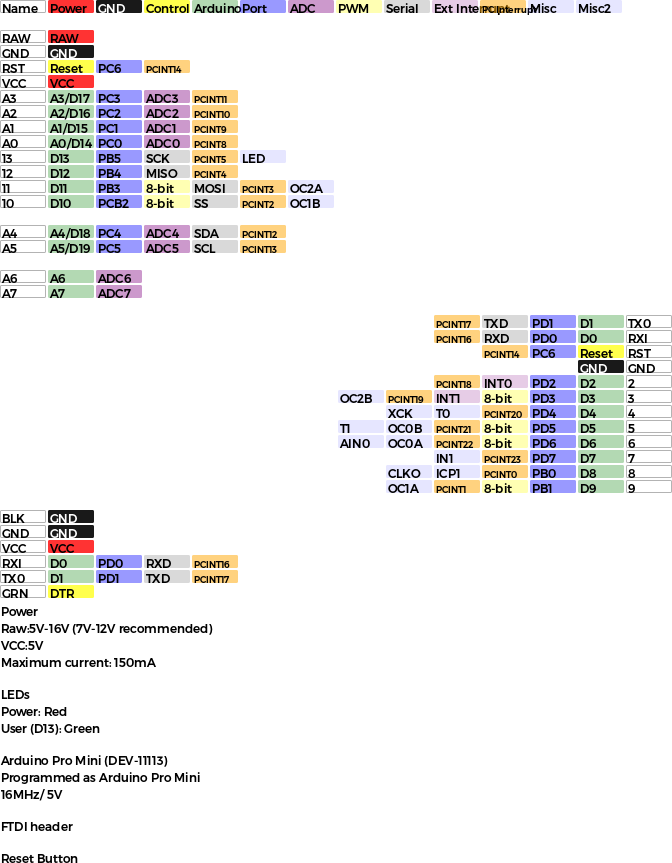
Generated Cells After Running Script
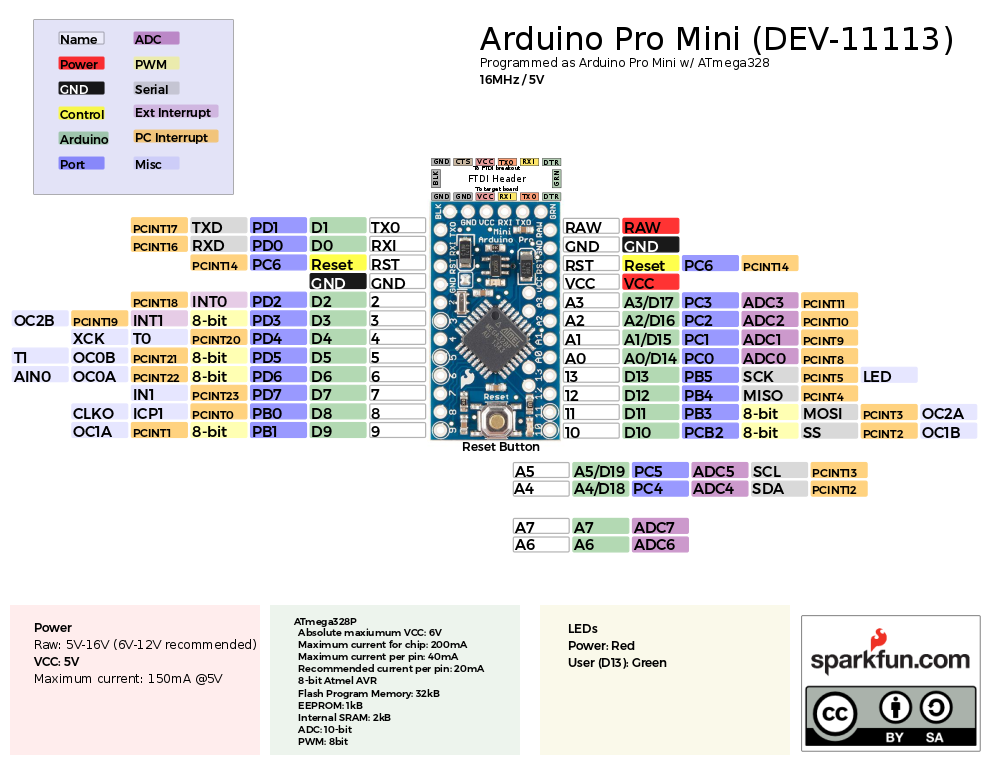
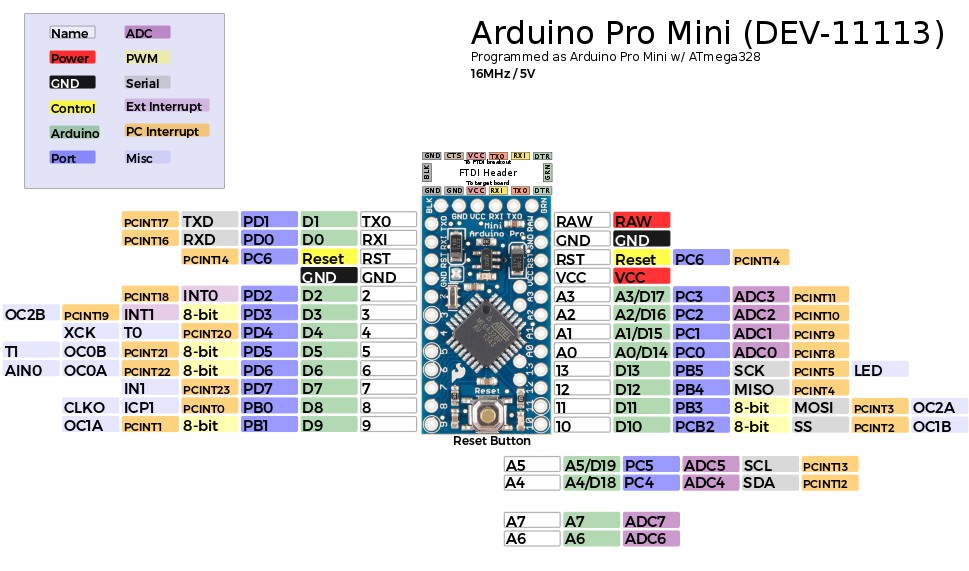
Example Completed Graphical Datasheet
This repo includes the Python script used to help generate the graphical datasheets. It also includes the final .svg, and .pdf files as well as the .csv files use for development boards. The .csv files were used as a starting point and some text did change between the file and the final version. There is also a User Submitted folder for external contributions.
Setting Up and Running the Script via Notepad++
One method is to use Notepad++ to edit and a plug-in to run the script. Download and install Notepadd++ v7.7.1 on your computer. From Notepad++'s Plugins > Plugins Admin… menu, search for PyNPP plug-in and install. We used PyNPP v1.0.0. You may need to search online, download the plug-in, and manually install on Notepad++ from the Settings > Import > Import plug-in(s)… menu. This plug-in is optional if you want to run the script from Notepad++.
We’ll assume that you have Python 2.7 installed. If you have not already, open up the command prompt. To check the version of Python, type the following to see if you are using Python 2 or Python 3. If you do not see Python 2, you will need to adjust your environment variables [i.e. System Properties > Environment Variables…, then System Variables > Path > Edit…, and add the location of your installed Python (in this case it was C:\Python27) to a field] to be able to use that specific version.
python --version
To manually install, download and unzip the svgwrite module (v1.2.0). In a command line, change the path to where …\svgwrite folder is located and use the following command to install.
python setup.py install
Create a CSV of the pinout for your development board. You can also edit the CSV from any of the examples. For simplicity, copy the Pro Mini’s file (…Graphical_Datasheets\Datasheets\ProMini\ProMini.csv ) and paste it in the same folder as the python script (…\Graphical_Datasheets). Open one of the tagscript.py scripts in Notepad++ and run the script from the menu: Plugins > PyNPP > Run File in Python.
A window will pop up requesting for the CSV file name. Enter the file name (like ProMini), it will output the SVG with the same name.
After running the script, open the SVG file in Inkscape (or Illustrator) with an image of your development board to align or adjust the pinouts! Feel free to adjust the script to format your cells based on your personal preferences. Have fun!
Setting Up and Running the Script via Command Line
You can use any text editor to edit the script. The following instructions do not require PyNPP. Additionally, it is an alternative method to install the svgwrite module and run the Python script via command line.
Again, we’ll assume that you have Python 2.7 installed. If you have not already, open up the command prompt. To check the version of Python, type the following to see if you are using Python 2 or Python 3. If you do not see Python 2, you will need to adjust your environment variables [i.e. System Properties > Environment Variables…, then System Variables > Path > Edit…, and add the location of your installed Python (in this case it was C:\Python27) to a field] to be able to use that specific version.
python --version
Open a command prompt and use the following command to install the older version of svgwrite.
python -m pip install svgwrite==1.2.1
Create a CSV of the pinout for your development board. You can also edit the CSV from any of the examples. For simplicity, copy the Pro Mini’s file (…Graphical_Datasheets\Datasheets\ProMini\ProMini.csv ) and paste it in the same folder as the python script (…\Graphical_Datasheets). Use the following command to execute the script.
python tagscript.py
A window will pop up requesting for the CSV file name. Enter the file name (like ProMini), it will output the SVG with the same name.
After running the script, open the SVG file in Inkscape (or Illustrator) with an image of your development board to align or adjust the pinouts! Feel free to adjust the script to format your cells based on your personal preferences. Have fun!
Required Software
Some software used to create graphical datasheets. At the time of writing, Python 2 was used to generate the cells. Note that support Python 2 has ended but the tools should still work if you are using archived versions of the plug-in and module. You may need to adjust the script to work with the latest NotePad++, NyPP plug-in, Python 3, and svgwrite versions.
Notepad++ v7.7.1 - Text editor to modify the Python script
PyNPP v1.0.0 - Optional plug-in to run Python Scripts
Python v2.7.13
svgwrite v1.2.0 - The script uses this version of svgwrite which is compatible with Python 2
Inkscape v0.92.4
Repository Contents
/Datasheets - CSV of pinouts and graphical datasheets for development boards
tagscript.py - Script to generate cells for graphical datasheets
tagscript_original-mshorter.py - Original script to individually modify each column attribute if necessary
GitHub
https://github.com/sparkfun/Graphical_Datasheets
Source: https://pythonawesome.com/code-and-information-on-the-sparkfun-graphical-datasheets/